Tuesday, February 27, 2018

Understanding the $gopath

One of the struggling issue for some newbies for golang is this $GOPATH.


Above are some of the issues that can cause from the $GOPATH. So It's always better to understand what the hell is this $GOPATH and simply how it works.

If you have already installed golang, open up a terminal or cmd and type 
> go env
go specific environment variables

Then it will show all the available environment variables that needs for the golang. Our only focus is to understand this $GOPATH. simply $GOPATH is a environment variable. 
  1. Is that it ? 
  2. What is it for ?

Look at my $GOPATH. I have set it to the C:\Users\User\go-projects


Sooooo is that means the $GOPATH == working directory ?
Actually if you think like that and set it to your working space will solve the problem. But how ?

Lets look at how a go project structure looks like

my-go-project
  |__src
  |__pkg
  |__bin

all the source code is manage by this src folder. Lets look at how the go lang source's src $GOROOT folder looks like

$GOROOT/src folder structure
Simply it shows the folders that contains particular package's source code.  for a example when we need the fmt API we access this $GOROOT/src path of fmt package and it's publicly exposed source.


So always the $GOROOT contains all the core packages. Ok then what about other packages. I mean 3rd party packages. Check this awesome go site


3rd party library import format of golang

What if you have a 3rd party dependency from github.com. There can be other 3rd part libraries from gitlab.comsourcegraph.comgolang.orggopkg.in, etc... 
  1. How the go try to find those dependency ? 
  2. If not where and how go try to install those dependency ?
First it looks inside the $GOROOT/src (C:\Go\src)if that particular dependency is not there it goes to $GOPATH/src (C:\Users\User\go-projects\src) and looks weather it can finds it.

Once you make the > go get command it will install the dependencies to the $GOPATH/src folder.

So It's always a good practice to maintan your all go project paths inside the $GOPATH. create a root go-projects folder and make that folder path to $GOPATH. then you can manage your and other 3rd party project clearly. If you got any issues retaliated go dependency you know where to look at. 

In this structure whenever you build your project or 3rd party project binary will goes to $GOPATH/bin pkg files related to src goes to $GOPATH/pkg

Basic golang src project structure 
This is how a github projects lives inside the $GOPATH. So keep your and 3rd party projects in one place. Use $GOPATH wisely. 
Note you can have multiple $GOPATH

Ubuntu: export GOPATH=path1:path2:path3...
Windows set    GOPATH=path1;path2;path3

But I prefer 1 $GOPATH just one path to avoid the complexity. 


Hope you guys understood #HappyCoding :) 


Sunday, February 5, 2017

Windows terminal automated tasks with conemu

I'm a Ubuntu fan and I recently shift into Windows. For me the main issue was the terminal in Windows, in Ubuntu there were some great tools to handle multiple tasks at once such as tmux, vim etc .. . I mostly used to tmux to handle multiple windows and split terminal horizontally and vertically to run multiple tasks.


Figure 1: ConEmu running multiple tasks on different windows powershells

Finally my dream came true for windows. This great ConEmu tool helped me to handle the same thing that tmux does and much more.

The best thing is in ConEmu you can write task to automate multiple tasks like in Figure 1 that you can run it any time within a click. The screenshot shows 4 different tasks running in 4 splited tabs.
  • Vim editing a file
  • Running a node server
  • Running a test suite
  • Running a git status
Writing a automated task like above is super easy. I'll explain how to write the Figure 1 task inside ConEmu.
Prerequisites: 
  • Download ConEmu :)
  • Hope you have installed vim for windows. (If not you can replace notepad command for vim)
  • I have used react-boilerplate project for this scenario. 
  • After you cloned the above project you may need to execute npm run setup command.
Now lets dig in to task creation.

This is the complete task for Figure 1 setup

powershell -new_console:d:C:\Users\noely\Documents\development\learn\react\react-boilerplate -noexit vim .\app\index.html

powershell -cur_console:s50H:d:C:\Users\noely\Documents\development\learn\react\react-boilerplate -noexit npm start

powershell -cur_console:s50V:d:C:\Users\noely\Documents\development\learn\react\react-boilerplate -noexit npm run test:watch

powershell -cur_console:s50V:d:C:\Users\noely\Documents\development\learn\react\react-boilerplate -noexit git status

If you want to run this task add this task to ConEmu under Settings > Startup > Tasks. To open settings use Win+Alt+P. I have created a task called react-dev.


Figure 2: Adding above automated task to ConEmu

Detailed explanation can be found here.

  • According to the Figure 1 screenshot you can see left terminal windows is running a vim editor.
  • Note ConEmu can run any installed terminal such as cmd, powershell, gitbash (if you have already installed in the system)
  • In this case I will use powershell console to run the vim editor.
  • If you can see in first command I have used -new_console command it's to create new powershell window, so then we can use that same window to split and run multiple tasks.
  • After the -new_console command I have specified another command called :d  which is used to set a initial directory path to start the new poewershell console.
  • What about the -noexit flag, It's for telling that do not exit the console after the task is done. (ex: if you kill the server it wont remove the terminal from the window). Even though you are done with that terminal you can do any other task on that, 
  • Then I have add a open a file command in .\app\index.html using vim editor (vim file_path)
  • Now lets dig in to 2nd command, there I have used -cur_console which represents newly created console to run new commands.
  • Then I have split current terminal window to 50% horizontally using :s50H. V  - vertical split 
  • Same as previous I have used d: to navigate to the working directory to start commands such as
    • npm start (start server)
    • npm run test:watch (run test task)
    • git status
Now It's time to run the automated task
                                               Figure 3: Running the automated task


I hope you understood creating a simple automated task in ConEmu tool. You can refer their doc and automate any task using current terminal.

Saturday, November 19, 2016

Experimenting with NodeMCU DevKit


1. What the heck is NodeMCU


Simply It's a cheap arduino like micro-controller with some new built in features. OK what are those new features ? Mainly it's all about wifi. Yes It has a built in wifi module, the latest NodeMCU devkit use ESP8266 SMT Module - ESP-12E (main chip) which has 4MB of flash memory and tons of IO pins with Lua Firmware(I'll explain about this on 2nd topic NodeMCU Firmware Features).


Figure1.1 - ESP8266 SMT Module - ESP-12E Module

Now you know about the main chip, heart of the NodeMCU devkit. So what is this NodeMCU devkit. You can think it as like this, Its a simplified wrapper for developers who wants to rapidly prototype and write and push their code quick. In other word it's a breakout board (It takes a single electrical component and make's it easy to use). 

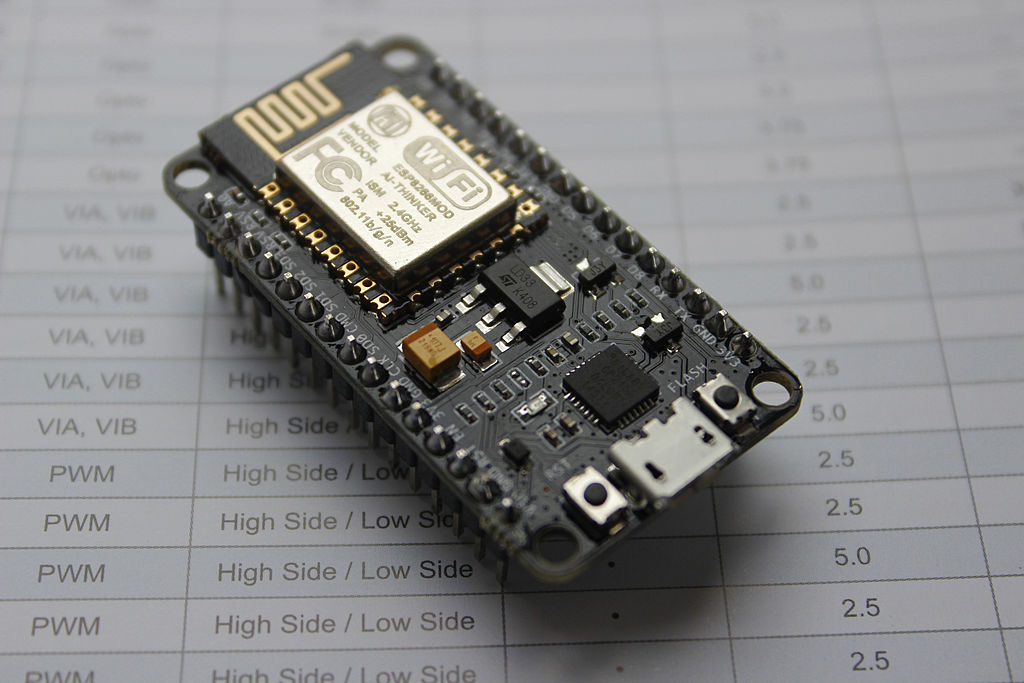
Figure1.2 - NodeMCU DEVKIT V1.0


It's a beautiful little circuit board isn't it. :) Ok according to Figure 1.2 mainly you can see there's a micro usb port + IO pins coming out of the board. Time to explorer some abilities of this piece of hardware. I mentioned two words "Lua Firmware" which lives in the main module (ESP8266 SMT Module - ESP-12E Module) . We'll discuss some features that Lua Firmware has.

2. NodeMCU Firmware


NodeMCU firmware is a Lua based firmware for the main chip (ESP8266 SMT Module - ESP-12E Module) according to nodemcu-firmware project more than 98% of the code is written in C and have used a small Lua interface to simplified the development. Finally :) Cool right !. This firmware helps to work with wifi, serial, gpio communications etc... Lets see what are the main cool features support by this firmware.

  1. Supports 40+ modules (APIs). 
    • WIFI - what keeps all the things connected together.
    • GPIO -  manipulate IO pins (digital, analog).
    • HTTP - www open the connection to the world (clients, servers).
    • MQQT - best for IoT communication.
    • WEBSOCKET - now most of the the things are real-time (widely support communication).
    • JSON - manipulating JSON data (encoding, decoding).
    • FILE  -  Remember 4MB of space :)  (read, write).
    • + More ...
  2. Easy Peasy API.
    • Lua based API.
    • Really good documentation.
    • Real-time line by line code testing capability  (They have provided a REPL (read, evaluate, print, loop) tool we'll look in to that in 5th topic Playing time with NodeMCU) .
    • Asynchronous event-driven programming model. (Which makes more scene :) )
  3. Custom firmware builds
    • This is a cool feature, we can build the latest firmware easily and push it to the NodeMCU.
    • We can build the firmware with floating point support or only integer support. (integer based firmware takes less memory). 
    • We'll dig in to above features in next topic Building latest and custom firmware

3. Building latest and custom firmware


Now we a have overall idea about what NodeMCU is and what it can do. Now its time do something in action.
  1. Docker (Engine & Client) - How to Install docker to your system (Windows/Linux)
As I mentioned in "2nd topic NodeMCU Firmware" you can build any custom firmware you want and install it to devkit via the micro USB. Lets see how it's done easily. In this topic we'll focus only the firmware building process (Dont worry it's super easy). There are 3 ways to build  the firmware
  1. Cloud build service
  2. Docker image
  3. Linux build environment
I found out only 1 and 2 are the most easiest way to get the firmware binary file.

Via Cloud build service (Super EASY)
First you have to visit to their build service: https://nodemcu-build.com/  ( Obviously, What am I writing :D )
From this service it's supper easy to get the firmware build. We can easily customize the modules and other options through their web interface Figure 3.1. You can select which modules need to activate or enable from the firmware so you can save more memory for your code.
Figure 3.1 - Cloud Build Module Customization

After few minutes you will get a mail with 2 download links to firmware build files
  1. nodemcu-master-10-modules-date+time-float.bin
  2. nodemcu-master-10-modules-date+time-integer.bin
As I mentioned you can either use float or integer firmware (Integer takes less space) What the heck you have 4MB flash use float bin :)

Via Docker image
This is my favorite way of building the firmware. May be because of I'm in love with docker. Anyway if you are planing to use the firmware for production it's good to rebuild it using the cloud build service with custom modules. This method will build whole master/dev branch with all 40+ modules. Time to execute some instructions.

  1. First things first - Pull the docker container of nodemcu-build  
    • docker pull marcelstoer/nodemcu-build  
  2. Clone the nodemcu-firmware repository
    • git clone https://github.com/nodemcu/nodemcu-firmware.git
  3. Navigate to nodemcu-firmware project folder and execute the docker command to buid
    • docker run --rm -ti -v `pwd`:/opt/nodemcu-firmware marcelstoer/nodemcu-build
  4. After 2-3 minutes you can find the build files inside bin folder. There can be several bin files, you only need to care about integer/float bin files
Next topic I will discuss how to push these firmware binaries to NodeMCU module.

4. Update the firmware


Now we have the firmware binary file. It's time to update the NodeMCU with latest module features. Man I love this part = )

Now I'm gonna introduce a tool called esptool which helps to upload the firmware to nodemcu really easily. Lets see what are the steps you need to follow

  1. Clone the esptool project.
    • git clone https://github.com/espressif/esptool
  2. You can find a executable python file "esptool.py" inside esptool folder.
  3. Plug your NodeMCU via micro USB.
  4. Execute 1st command to erase the whole NodeMCU firmware. (You need to provide the connected USB port)
    1. ./esptool.py --port /dev/ttyUSB0 erase_flash (Linux)
    2. python esptool.py --port COM1 erase_flash (Windows)
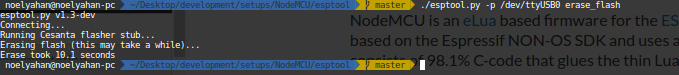
  5. Note: erase command will erase all Lua scripts that have uploaded.
  6. It will take few seconds to complete the whole erasing task. 
  7. Now you have a completely empty and useless NodeMCU module :( don't worry now is the time to give completely new BRAIN.
  8. Note: Do you know NodeMCU has a bug :) Ok don't worry there's a solution and small fix to it. The bug is, when you erase the whole flash and push our firmware build to NodeMCU it wont work. For that issue they have created a patch [ Download SDK patch 1.5.4.1 ] (Seems to be a hardware issue in ESP8266 wifi module).
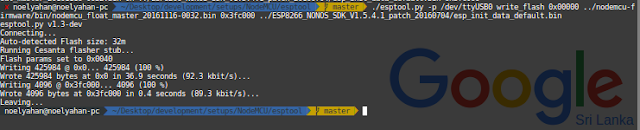
  9. Brace your self now is the time to upload the firmware with this patch. You need only 2 files
    • nodemcu_float_master_xxxxxxxx-xxxx.bin - (NodeMCU firmware)
    • esp_init_data_default.bin - (NodeMCU patch file, You can find this file after extracting the ESP8266_NONOS_SDK_V1.5.4.1_patch_20160704.zip)
  10. Lets execute the command :) 
    • ./esptool.py --port /dev/ttyUSB0 write_flash 0x00000 ../nodemcu-firmware/bin/nodemcu_float_master_20161116-0032.bin 0x3fc000 ../ESP8266_NONOS_SDK_V1.5.4.1_patch_20160704/esp_init_data_default.bin
  11. DONE ! Oh wait we need to test It out :)  Next and Final topic will explain the actual power of the NodeMCU.

5. Play time with NodeMCU


Now I'm gonna introduce another tool. Oh don't worry this is the last and best tool that I'm gonna introduce to you . The tool is called ESPlorer This will help us to push the code inside NodeMCU super duper easily. It's a java app so no need to worry :)

After you download and extract the file from their site. you can start the ESPlorer tool really easily
  1. If you are a Linux user like me > java -jar ESPlorer.jar
  2. If you are a Windows user > execute the bat file
  • After the application starts you need to select the USB port, Baud rate to 115200 and press open button.


  • Some times you may need to click on some buttons at the bottom (Heap, Chip Info, etc..) to open up the connection properly.
 
  • Now it's time to test a typical LED blink app, There's a nice testing blink Lua script in github.
  • Copy and paste the code to Scripts section.
  • Click on Send to ESP button.
  
  • Suddenly you can see your NodeMCU will blink it's built in LED.
  • I'm so HAPPY Now !!
  • I almost forgot about wifi. It's super easy now.
  • Can you see a small text box on bottom of the right hand side with a send button (That's the miracle button)
  • You can easily type a code and evaluate in real time. Lets print out some ip address in station mode
  • Copy and paste this code line and look at the result:  print(wifi.sta.getip())
 
  • Cool isn't it. Now you have a solid playground to explorer more and more API features in NodeMCU. Hope My Blog Post Was Helpful To You :)  
#HappyCoding #SeeYouLater

Wednesday, March 9, 2016

Deploy WSO2 products on OpenShift v3

What is OpenShift ?
Simply it's a open-source platform as a service product. It allows to manage, deploy, monitor the applications.

What's new ?
OpenShift v3 is the latest version it also called as OpenShift origin. Mainly new version allows to deploy containers and orchestrate using help of  kubernetes.
OpenShift supports
  • Source-To-Image (S2I)
  • Template (JSON)
  • Container (Docker)
deployments. For this I'm using container based deployment.

Installing OpenShift

There is a openshift all in one vm  or It's available as a docker all in one container. I'm using the docker container for this. I'm using ubuntu 15.04v because ubuntu 14.04 have some known issues and the docker client and server versions are 1.9.1v.
Note: If you decided to use vagrant openshift all in one vm you can directly jump to "Deploying WSO2 products" step

To pull the origin image and start the container use
sudo docker run -d --name "origin" \
       --privileged --pid=host --net=host \
       -v /:/rootfs:ro -v /var/run:/var/run:rw -v /sys:/sys -v /var/lib/docker:/var/lib/docker:rw \
       -v /var/lib/origin/openshift.local.volumes:/var/lib/origin/openshift.local.volumes \
       openshift/origin start

Start the container
sudo docker exec -it origin bash

Configuring OpenShift

Before proceeding to next step there are some configurations need to be done. Openshift latest version use oc CLI.

First need to login as administrator, can use any password
oc login -u system:admin

OpenShift ships with a built in docker registry image, to configure and start a registry container use
oadm registry --credentials=./openshift.local.config/master/openshift-registry.kubeconfig

Deploying WSO2 products
Again you should login as a different user, in this case i will use noelyahan, can use any password you want
oc login -u noelyahan

Now we may need to create a project before add new applications
oc new-project wso2-products

Now it's time to deploy docker containers from image, I have pushed some docker images to my docker hub profile so you can simply use
oc new-app noelyahan/wso2-esb-openshift
oc new-app noelyahan/wso2-jaggery-openshift

You can use the openshift management console to monitor or control from ui, but still openshift cli allows to control everything such as scale up, scale down, log view, deployment status etc ..

To pull a container and start, it took several minutes for me but for spin up new pod it took less than a minute.

WSO2 ESB and WSO2 Jaggery running with multiple nodes

Overview of the deployment

One running container instance

Running container terminal log

Apply routing for service
Now service is running it's own private IP address, to access the service from the outside world we need to create a route.The docker containers exposing some ports 9443, 9763 that means we can map these target ports and create a new domain name that route to running services.

  • Go to Browse > Routes there's a option to create a route
  • WSO2 products are running on https that means when we need to create a secured route


Routing figure 1


Routing figure 2 : Adding a passthrough routing type

Accessing the service url through the routed url

References

Thursday, November 5, 2015

Debugging Dart web app with WebStrom

Debugging a Dart application is pretty much easy with WebStrome IDE. But there are several steps to follow

  • Install  JetBrains Chrome Extension (Later need to setup by providing the correct port and ip)
  • Open the web application with webstrome by clicking on the html page's browser icon (top right corner)
    •  


  • Most probably it'll open with host=>127.0.0.1 & port => 63343
  • Right click top of the JetBrains Chrome Extension -> Options

  • Change the Host and Port values and apply the changes
  • Now It's time to setup the Javascript Debugger in webstrom go to Run -> Debug -> Edit Configuration
  • Add Javascript Debugger with + icon
  • Add the web page URL to debug configurations
  • Ok Done ! Lets test a sample app and see
  • Make a break point anywhere in dart source code
  • Simply go to Run -> Debug Dart_Debug (in this case I gave this name)
  • It'll open the web application with new tab, when it'll hit the brakpoint it should work
    • Whoo Hoo !!!

Friday, August 14, 2015

WSO2 multi-tenant cache JSR107 update

Current Carbon-Kernel v4.4.0 caching is based on JCache v0.5. This Blog is about new JSR107 (JCache) v1.0 update in Carbon-Kernel based on new Hazelcast caching provider. 

Topics
  • What is JCache
  • Whats in latest JSR107 (JCache) in high level view
  • WSO2 Caching
  • New caching API changes in WSO2 Caching
  • Examples of new caching API

What is JCache ?
   Caching is proven method to increase scalability and performance. JCache (JSR 107) is a standard caching API for Java. It can keeps some data in low-latency data structures for some period.It provides an API to create and work with in-memory cache of objects. It allows to create, access, update and remove entries from caches.JCache API only provides set of high level components (interfaces) to work with caching other than thinking about the implementation of the caching

Some common use cases
  • Client side caching of Web service calls
  • Caching of expensive computations such as rendered images
  • Caching of data
  • Servlet response caching
  • Caching of domain object graphs


Latest JSR107 (JCache) in high level view

Caching Provider – used to control Caching Managers and can deal with several of them,
Cache Manager – deals with create, read, destroy operations on a Cache
Cache – stores entries (the actual data) and exposes CRUD interfaces to deal with the entries
Entry – abstraction on top of a key-value pair akin to a java.util.Map


jcache-archi.png


WSO2 Caching
Core Features
  1. Local and distributed mode
  2. L1 and L2 caching model for distributed mode
  3. Multi-tenancy
Local and distributed mode: carbon kernel has 2 different jcache implementations called local and distributed, default it use local cache when the Axis2 clustering is enabled it use distributed cache.In jcache v0.5 for distributed map carbon-kernel used Hazelcast distributed maps but in new jcache v1.0 for distributed cache it use Hazelcast caches.

L1 and L2 caching model for distributed mode: In order to improve performance there are 2 types of caching models called L1(Level 1) and L2(Level 2) caching, L1 cache is implemented by HashMaps, and new L2 cache is implemented by Hazelcast cache (wrapper of jcache v1.0 API).Every first time it checks in L1 cache but if the value is located in the L2 cache, then the value is also stored in the L1 cache

Multi-tenancy: It can cache and provide tenant specific data and make it available in every and each cluster members.

Sequence diagram of L1 and L2 caching model
wso2-caching.png


In the distributed mode, if a cache entry is removed, invalidated or changed then the Hazelcast Cache Entry listeners that registered will trigger on each and every Hazelcast cluster member, In that same time L1 cache and the L2 cache being removed or updated

Sequence diagram of remove item

wso2caching-remove-item.png

New caching API changes in WSO2 Caching
  • In previous jcache version, to create a CacheManager object had to call CacheManagerFactory and parse the name to CacheManager
    • Caching.getCacheManagerFactory().getCacheManager("sampleCacheManager");

  • New version of jcache use CachingProvider to create CacheManager by parsing a URI(String) object
    • Caching.getCachingProvider().getCacheManager(new URI("sampleCacheManager"));

  • To create a custom cache with custom configuration no need to call createCacheBuilder() to and parse the configuraion object, now CacheManager can directly call getCache() by parsing a cacheName and CacheConfiguration object

  • Other than that the org.wso2.carbon.caching.impl.CacheImpl class distributedCache is changed to Hazelcast cache (v4.3) insted of using Hazelcast Maps
    • hazelcastCacheManager = DataHolder.getInstance().getHazelcastCacheManager();

  • Because the Hazelcast cache is distrbuted one, There's no need of having registered OSGI service called DistributedMapProvider so the service intarface has removed from the org.wso2.carbon.caching and also from the org.wso2.carbon.core.clustering.HazelcastDistributedMapProvider

  • Other API changes are done to
    • org.wso2.carbon.user.core
    • org.wso2.carbon.registry.core

Examples of new caching API


Example: Simple cache creation


Example: Using cache configuration with a custom cache expiry


Please feel free to test out the new jcache v1.0 implementation